The Morning Edition (July 10, 2013)

From Last Night:
- Hamels twirls a gem against the Nats
- CC goes the distance, but Shields and the Royals hold off the Yanks
- Josh Johnson has a good day, but the Tribe shut out his Jays
- Machado homers, but the Rangers beat the O’s 8-4
What I’m Watching Today:
- Jacob Turner takes the hill (1230p Eastern)
- Wheeler and Cain (330p Eastern)
- Gio and Lee from the left side (7p Eastern)
- Miller faces the Astros, strikeout warning in effect (8p Eastern)
The Big Question:
- How much should we care about pitcher-hitting?
Dave Cameron threw out some tweets today regarding the (false) perception that the Pirates can’t hit citing that they are 11th in MLB in non-pitcher wRC+. However, their pitchers are comically and historically bad, as Jeff Sullivan noted earlier this year. So while the Pirates non-pitchers are almost in the top 3rd in wRC+, they fall off a bit when you add in their pitchers and are in the bottom third in runs scored. PNC is a pitchers park, but not in an extreme way. All told, it got me thinking. We don’t really think of pitchers as part of the offense, but they get 2-3 PA a game and can have a meaningful impact on the outcome of a game. I think it might be time to either add the DH to the NL or start seriously considering how much a team can benefit from pitchers who are good at hitting. We tend to brush it off, but might their be something to paying attention to how well a pitcher can hit? I don’t know, but it got me thinking.
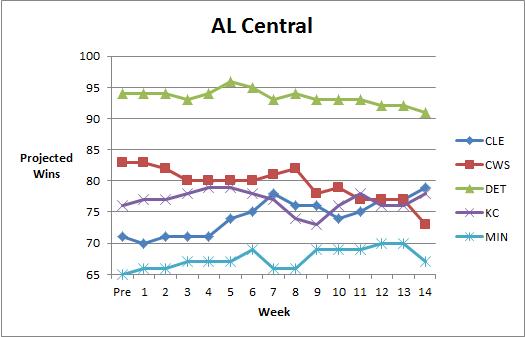
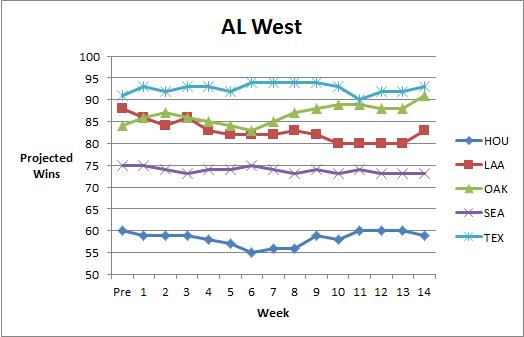
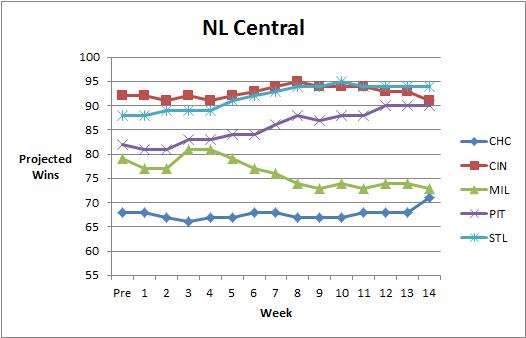
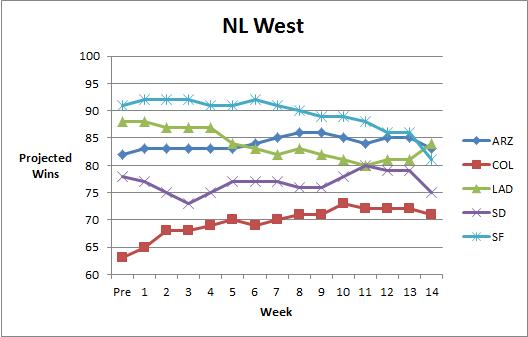
Dynamic Standings Projection (July 10, 2013)
In case you missed it, in April we launched our Dynamic Standings Projection feature on New English D. A full explanation of the methodology can be found here or by clicking the tab at the top of the page. This project seeks to provide a reasoned and cautious approach to updating our beliefs about the baseball future. You can find a summarization of the original projections here. You’ll notice a column on the far right that indicates the difference in projected wins from the preseason prediction. Positive numbers mean teams are now projected to win more games and negative numbers mean a team is now projected to win fewer games. You’ll notice a series of graphs below the standings section that track how the projections have evolved over the course of the year.
This Dynamic Standings Projection is updated through the July 9 games.
| 10-Jul | W | L | PreDiff | |
| TB | 91 | 71 | 0.562 | 0 |
| BOS | 88 | 74 | 0.543 | 11 |
| NYY | 86 | 76 | 0.531 | 1 |
| BAL | 85 | 77 | 0.525 | 3 |
| TOR | 82 | 80 | 0.506 | -5 |
| W | L | PreDiff | ||
| DET | 91 | 71 | 0.562 | -3 |
| CLE | 79 | 83 | 0.488 | 8 |
| KC | 78 | 84 | 0.481 | 2 |
| CWS | 73 | 89 | 0.451 | -10 |
| MIN | 67 | 95 | 0.414 | 2 |
| W | L | PreDiff | ||
| TEX | 93 | 69 | 0.574 | 2 |
| OAK | 91 | 71 | 0.562 | 7 |
| LAA | 83 | 79 | 0.512 | -5 |
| SEA | 73 | 89 | 0.451 | -2 |
| HOU | 59 | 103 | 0.364 | -1 |
| W | L | PreDiff | ||
| ATL | 92 | 70 | 0.568 | 2 |
| WSH | 88 | 74 | 0.543 | -7 |
| PHI | 82 | 80 | 0.506 | -2 |
| NYM | 75 | 87 | 0.463 | -3 |
| MIA | 60 | 102 | 0.370 | -3 |
| W | L | PreDiff | ||
| STL | 94 | 68 | 0.580 | 6 |
| CIN | 91 | 71 | 0.562 | -1 |
| PIT | 90 | 72 | 0.556 | 8 |
| MIL | 73 | 89 | 0.451 | -6 |
| CHC | 71 | 91 | 0.438 | 3 |
| W | L | PreDiff | ||
| LAD | 84 | 78 | 0.519 | -4 |
| ARZ | 83 | 79 | 0.512 | 1 |
| SF | 81 | 81 | 0.500 | -10 |
| SD | 75 | 87 | 0.463 | -3 |
| COL | 71 | 91 | 0.438 | 8 |


Why You Should Give Sabermetrics A Try
A lot of ink has been spilled over the old-school versus new school debate in baseball analysis and while I’m decidedly on the new school side of things, I firmly believe that the reasons we have a difficult time winning converts is because we’re often too quick to act like our views are obviously the right ones. This isn’t a matter of sabermetricians getting the wrong answers, but we don’t often do enough to make our findings clear to the public. Sometimes we get caught up talking to each other and not talking to everyone.
Don’t get me wrong, I love Fangraphs and other sabermetric heavy sites, but we don’t always do the best job of making the basic principles clear. When someone writes a great post at Fangraphs, they don’t explain why they use wOBA instead of OPS or batting average, they take it as a given and expect the reader to know why or to look it up. Which makes less informed baseball fans weary. It’s not that they’re stupid, I don’t think that at all, it’s that they haven’t been given a proper explanation for why we think what we think on this side of the debate.
The sabermetric community offers a lot of resources that explain statistics, but we leave the curious fan with little guidance. It’s not hard to tell why some people here us talking about Wins Above Replacement and start thinking we’re nuts. It’s out job to explain what we’re doing and it’s our job to sell the message correctly. We’ve done so much groundwork in baseball research that we often forget that a new person is learning about the value of walks everyday, and that’s something we just take as a given.
Which is why it’s important for baseball analytics to have a public relations aspect of it too. Brian Kenny from MLB Network and NBC Sports Radio is a great voice for that part of the task. He’s done excellent work bringing sabermetrics into the mainstream of sports coverage. Plenty of others do excellent work on the matter, but he’s made it a mission.
At New English D, we’d like to be a part of that, and often publish basic explanations of sabermetric stats and principles while also pointing out some flaws in the basic stats. Today, I’d like to do something different. Today, I’d like to explain why you should give sabermetrics a try, period. I don’t care how skeptical you are, give me the next 5 minutes.
Here are 5 reasons:
1) The basic statistics were crafted during another era.
Batting average, runs, RBI, SB, wins, ERA, and the other statistics you’re familiar with quite readily were invented in the 1920s to keep track of what happened on the field. They are scoring statistics to record exactly how the game progressed. They’re descriptive and that is great. You can look at a box score and see exactly who was on base and who was at the plate when each run scored, but you can’t always tell which players were most responsible for the win or loss. These stats don’t tell you that much about value. It’s not because these stats are stupid, it’s because they didn’t have calculators and computers to do calculations when these numbers were invented. When you’re using a slide rule or pen and paper to track stats, things have to be simple. They don’t have to be simple anymore because we have the power to compute more information. It doesn’t mean getting a hit with a runner on second isn’t important, it means RBI is a crude way to measure that skill.
2) Progress is good.
Sabermetricians have introduced many new statistics into the world in the last couple decades, and while that might seem unseemly and cluttered, it’s actually no different than anything else. We didn’t use to fly on airplanes or drive cars, we didn’t used to be able to watch any baseball game on the internet. Heck, we didn’t even have the internet until the 1990s. No one is running around telling everyone to write more letters and put them in mailboxes, we have all pretty much embraced e-mail, texting, and instant messaging. Communication got better and more efficient. We’re better off. Baseball analysis is the same way. These new stats tell us more about baseball than we used to know. Players who walk a lot used to be really undervalued until someone with a computer looked at a lot of baseball games and realized that getting on base is really good, whether you get on via a hit or a walk. Things get better when we develop new technologies. You wouldn’t disable your internet connection, don’t immediately shut out new stats.
3) We’re asking the same questions.
Sabermetricians and traditional analysts both care about what leads to wins. Traditional analysts tend to just focus on who wins and loses and reverse engineer the explanations, but sabermetrics is just breaking it down a different way. Let’s go through a little thought experiment:
- How do you win? You score more runs than the other team.
- How do you score more runs than the other team? You score runs and you prevent runs.
- How do you score runs? You get on base.
- How do you get on base? You get a hit or you walk.
- How do you prevent runs? You don’t let the other team get on base.
- How do you keep them off the bases? You don’t allow hits or walks.
- How do you prevent hits? Don’t let them put the ball in play or hit homeruns, so strikeouts are good. You can also induce groundballs and use your defense if they are good.
When you think about the question like that, you realize we’re all asking the same thing. Sabermetricians break it down into how you score and prevent runs and they look for what leads to both of those outcomes. It’s nothing devious or nerdy. It’s 100% about scoring runs and preventing them. We’ve just looked at enough data to know which actions lead to both and which actions don’t. Sometimes there is luck involved and you can’t predict luck. We’re all about playing the odds. That’s no different from anything else, it just looks different because we’re using numbers instead of intuition.
4) More information is good.
Even if you like the old statistics, that doesn’t mean the new ones are wrong. If a player has a high batting average, that tells you something about their performance. But so does their on base percentage. So does their slugging percentage. So does Weighted On Base Average (wOBA). So does Wins Above Replacement (WAR). It’s all information about the players and teams. Sabermetricians like these new stats for a reason. The reason is that they tell us something the other statistics do not. Batting average is fine, but it doesn’t tell you if the player is getting on base via a walk. You might not think walks are as good as hits (we don’t either!), but walks are WAY BETTER than outs. Batting average pretends walks don’t exist and we think that’s silly. RBI tells you how many runs a batter has driven in, but it doesn’t tell you how many opportunities that batter has to drive someone in. It’s not fair to Joey Votto that he hits behind Zack Cozart and Prince Fielder gets to hit behind Miguel Cabrera. Those two players are in different contexts. Sabermetrics likes to provide context neutral information. Players can only control certain aspects of the game and we don’t think it’s right to judge a player on things outside of his control. This is especially true for pitchers, who can’t control how much run support they get, how well their defense plays, or which pitcher is on the mound for the other team. Sabermetrics looks at that and says, wins aren’t a great way to measure a pitcher’s performance because most of what leads to a win is out of their control. Let’s look at what is in their control and see how well they do at that.
5) The logic is exactly the same.
When you look at RBI or Wins or Batting Average to judge a player, you’re using statistical information to make an inference about how good that guy is. You’re taking information recorded in the past to make a claim about the present and future. It doesn’t matter if you’re using your eyes during an at bat or a spreadsheet in January, the logic is the same. Past behavior informs predictions about the future. For sabermetricians, we’re just using a lot more information because we have found that using more information and certain kinds of information tends to help make better inferences. For example, this is where the tired phrase “small sample size” comes into play. We’ve looked at a ton of data and see that a really good batting average over a ten day stretch doesn’t predict what the player will do on day 11 very well. For statistics to reflect true talent, you needs bigger samples. It’s simple logic and you use it every day. If you think a player is about average and then they have two great days, how much do you change your mind? Not much. If you think a player is average and they have six great months, how much? Probably a lot more. Sabermetrics isn’t any different than that, it’s merely crunching the numbers to give us a better estimate about when information starts to become meaningful.
—
If you think about it like that, sabermetrics aren’t that foreign or nerdy. You might need to be a nerd to program a computer to spit out an answer to a question, but you don’t have to be anything but curious to understand what the answer is telling you. It’s isn’t that the old stats are terrible, it’s that they were developed when they had limited power to make sense of a complex game. You wouldn’t want a surgeon trained in the 1920s to operate on you, why let a statistic from 100 years ago inform you. Progress is good. Progress leads to more information and better understanding. You can absolutely disagree with a new stat, but you absolutely cannot disagree with a stat because it’s new. We’re asking the same questions and using the same logic, it’s just about being willing to expand the data you’re willing to use to evaluate those questions. You judge players by batting average, why wouldn’t you look at on base percentage too?
Ultimately, sabermetrics are a way to learn more about baseball and I can’t imagine not wanting to do that. I challenge you to learn more or to help others do the same. We have lots of information on this site under out “Stat of the Week” section and other sites offer much of the same. I’ll even make you a guarantee because I love baseball and learning that much. I will answer any question you have about baseball stats. Hit me on Twitter, in the comments, or on e-mail (See “About” above) and I will explain why I like one stat over another or what the best way is to measure something. Anything. That’s my offer. There’s no excuse not to give it a try, I’m pretty sure you’ll like it.
The Morning Edition (July 9, 2013)
From Last Night:
- Lannan sharp before Papelbon tries to give it away to the Nats
- 6 run 6th inning helps the Rangers and Holland top Feldman and the O’s
- Colon out duels Locke
- Gomez robs a Votto homerun to end the game in Milwaukee
- Braves score 6 in the 14th to beat the Fish
- Good starts on the west coast
What I’m Watching Today:
- Shields and CC hook up in NY (7p Eastern)
- Norris faces Wainwright in St. Louis (8p Eastern)
- Nolasco makes his first start with LA (930p Eastern)
The Big Question:
- Do you care about the homerun derby?
The HR Derby picks came out yesterday and NL features Wright, Cuddyer, Harper, and CarGo while the AL offers Cano, Fielder, Davis, and TBA (because apparently Cano can’t even get that right). A lot of people were upset with some of the picks because their hometown guy didn’t get picked or because someone strange (Cuddyer) or someone who was hurt (Harper) got picked. I don’t really care too much about the Derby, but someone people really seem to. It’s always seemed like a really weird publicity stunt that didn’t quite make sense. I’d like to see a reformatting. Thoughts?
The Morning Edition (July 8, 2013)
From Last Night:
- Corbin goes 8, strikes out 10 as the Snakes beat the Rockies
- Price goes the distance to beat the White Sox
- The Dodgers get 3 in the 9th to back Kershaw’s 8 strong innings
- The Cubs walk off in 11
- Fernandez looks ordinary in loss to the Cards
- The Nats back Strasburg in a slugfest with the Padres
- Rivera gives up a game winner to Jones and the O’s
What I’m Watching Today:
- Derek Holland comes to Camden (7p Eastern)
- Garza keeps on the trade audition tour against the weak hitting White Sox (8p Eastern)
- Bailey takes the mound for the first time since the no hitter (8p Eastern)
- Lester goes to Seattle to face Felix (10p Eastern)
- Matt Harvey takes his show to SF (10p Eastern)
The Big Question:
- Is this really happening again?
It is. Mike Trout is back on the chase after a homerun on Sunday night and now ranks 3rd among all MLB qualifiers with 161 wRC+, trailing only Cabrera and Davis. Mix in his great baserunning and better defense along with playing a more important defensive position and he’s only looking up at Miguel Cabrera on the WAR leaderboard. It’s Cabrera at 5.8 and Trout at 5.1. It’s happening again and I love it. Trout is essentially on pace to match his 2012 campaign, which would put him on some sort of ridiculous career trajectory. Think about this, Miguel Cabrera became the best hitter in the sport in his late 20s. Trout is 21. He’s probably at his peak defensively and on the bases, but he’s going to get better at the plate. What could this guy do? In the last 365 days, Trout (10.5) and Cabrera (9.2) are 1 and 2 in WAR and Trout already has more than 15 WAR in his career. Since 1901, only 2 players have accumulated more WAR through age 21: Mel Ott and Ty Cobb. That’s a list for ya.
SOEFA Sunday: Reliever Rankings Update (July 7, 2013)
You’ll recall last week we introduced are very own reliever rankings called SOEFA, which you can read about in detail here. For a brief refresher, it combines strand rate, expected OBP against, ERA-, and FIP- into a deviation from league average. Zero is average, and will generally range between -2.5 to 2.5. This includes all pitchers who have thrown at least 20 IP in relief. Should you wish to know the SOEFA for any other reliever, or on a day that isn’t Sunday, hit us on Twitter or in the comments section.
| Rank | Player | Team | SOEFA |
| 1 | Alex Torres | Rays | 1.33 |
| 2 | Sergio Romo | Giants | 1.03 |
| 3 | Joaquin Benoit | Tigers | 0.96 |
| 4 | Neal Cotts | Rangers | 0.9 |
| 5 | Drew Smyly | Tigers | 0.89 |
| 6 | Mark Melancon | Pirates | 0.88 |
| 7 | Jordan Walden | Braves | 0.84 |
| 8 | Jason Grilli | Pirates | 0.83 |
| 9 | Javier Lopez | Giants | 0.83 |
| 10 | Greg Holland | Royals | 0.83 |
| 11 | Kevin Gregg | Cubs | 0.79 |
| 12 | Jesse Crain | White Sox | 0.78 |
| 13 | Oliver Perez | Mariners | 0.77 |
| 14 | Sam LeCure | Reds | 0.75 |
| 15 | Glen Perkins | Twins | 0.75 |
| 16 | Brett Cecil | Blue Jays | 0.73 |
| 17 | Trevor Rosenthal | Cardinals | 0.72 |
| 18 | Kenley Jansen | Dodgers | 0.71 |
| 19 | Joe Thatcher | Padres | 0.68 |
| 20 | Edward Mujica | Cardinals | 0.67 |
| 21 | Preston Claiborne | Yankees | 0.66 |
| 22 | Junichi Tazawa | Red Sox | 0.66 |
| 23 | Shawn Kelley | Yankees | 0.63 |
| 24 | Sean Doolittle | Athletics | 0.63 |
| 25 | Casey Fien | Twins | 0.59 |
| 26 | Tommy Hunter | Orioles | 0.58 |
| 27 | Koji Uehara | Red Sox | 0.58 |
| 28 | Edgmer Escalona | Rockies | 0.58 |
| 29 | Josh Collmenter | Diamondbacks | 0.55 |
| 30 | Francisco Rodriguez | Brewers | 0.54 |
| 31 | Craig Kimbrel | Braves | 0.53 |
| 32 | Scott Downs | Angels | 0.52 |
| 33 | David Robertson | Yankees | 0.49 |
| 34 | Ryan Cook | Athletics | 0.49 |
| 35 | Andrew Miller | Red Sox | 0.48 |
| 36 | Robbie Ross | Rangers | 0.47 |
| 37 | Brian Matusz | Orioles | 0.47 |
| 38 | Jim Henderson | Brewers | 0.45 |
| 39 | Casey Janssen | Blue Jays | 0.44 |
| 40 | Luis Avilan | Braves | 0.44 |
| 41 | Aroldis Chapman | Reds | 0.44 |
| 42 | Matt Reynolds | Diamondbacks | 0.44 |
| 43 | Boone Logan | Yankees | 0.44 |
| 44 | Jonathan Papelbon | Phillies | 0.43 |
| 45 | Chad Gaudin | Giants | 0.43 |
| 46 | Anthony Varvaro | Braves | 0.43 |
| 47 | Dale Thayer | Padres | 0.43 |
| 48 | Bobby Parnell | Mets | 0.42 |
| 49 | Ernesto Frieri | Angels | 0.42 |
| 50 | Seth Maness | Cardinals | 0.41 |
| 51 | Rafael Soriano | Nationals | 0.4 |
| 52 | Josh Outman | Rockies | 0.4 |
| 53 | Matt Belisle | Rockies | 0.39 |
| 54 | Paco Rodriguez | Dodgers | 0.39 |
| 55 | Manny Parra | Reds | 0.39 |
| 56 | Luke Gregerson | Padres | 0.38 |
| 57 | Joel Peralta | Rays | 0.38 |
| 58 | Brandon Kintzler | Brewers | 0.36 |
| 59 | Addison Reed | White Sox | 0.35 |
| 60 | Grant Balfour | Athletics | 0.34 |
| 61 | Tom Gorzelanny | Brewers | 0.34 |
| 62 | Tanner Scheppers | Rangers | 0.34 |
| 63 | Jason Frasor | Rangers | 0.34 |
| 64 | Darren O’Day | Orioles | 0.34 |
| 65 | Brad Ziegler | Diamondbacks | 0.33 |
| 66 | Alfredo Simon | Reds | 0.33 |
| 67 | Luke Hochevar | Royals | 0.33 |
| 68 | John Axford | Brewers | 0.32 |
| 69 | J.P. Howell | Dodgers | 0.32 |
| 70 | Vin Mazzaro | Pirates | 0.32 |
| 71 | Joe Smith | Indians | 0.31 |
| 72 | David Carpenter | Braves | 0.3 |
| 73 | Steve Cishek | Marlins | 0.3 |
| 74 | James Russell | Cubs | 0.28 |
| 75 | Michael Kohn | Angels | 0.28 |
| 76 | Tony Watson | Pirates | 0.26 |
| 77 | Rafael Betancourt | Rockies | 0.25 |
| 78 | Jerome Williams | Angels | 0.25 |
| 79 | Antonio Bastardo | Phillies | 0.25 |
| 80 | Steve Delabar | Blue Jays | 0.25 |
| 81 | Nate Jones | White Sox | 0.24 |
| 82 | Chad Qualls | Marlins | 0.24 |
| 83 | Justin Wilson | Pirates | 0.23 |
| 84 | Jamey Wright | Rays | 0.23 |
| 85 | Tyler Clippard | Nationals | 0.23 |
| 86 | Troy Patton | Orioles | 0.23 |
| 87 | Pat Neshek | Athletics | 0.21 |
| 88 | Matt Thornton | White Sox | 0.21 |
| 89 | Jean Machi | Giants | 0.2 |
| 90 | Mariano Rivera | Yankees | 0.2 |
| 91 | Rex Brothers | Rockies | 0.19 |
| 92 | Craig Breslow | Red Sox | 0.19 |
| 93 | Cody Allen | Indians | 0.17 |
| 94 | Aaron Loup | Blue Jays | 0.17 |
| 95 | Greg Burke | Mets | 0.17 |
| 96 | Charlie Furbush | Mariners | 0.15 |
| 97 | Jose Veras | Astros | 0.15 |
| 98 | Tim Collins | Royals | 0.13 |
| 99 | Alfredo Figaro | Brewers | 0.13 |
| 100 | Jesse Chavez | Athletics | 0.12 |
| 101 | Bryan Morris | Pirates | 0.12 |
| 102 | Tyson Ross | Padres | 0.11 |
| 103 | Joe Nathan | Rangers | 0.11 |
| 104 | Dane de la Rosa | Angels | 0.11 |
| 105 | Al Alburquerque | Tigers | 0.1 |
| 106 | Jose Mijares | Giants | 0.1 |
| 107 | Darren Oliver | Blue Jays | 0.09 |
| 108 | LaTroy Hawkins | Mets | 0.08 |
| 109 | Joe Kelly | Cardinals | 0.08 |
| 110 | Anthony Swarzak | Twins | 0.07 |
| 111 | Fernando Rodney | Rays | 0.07 |
| 112 | Carter Capps | Mariners | 0.07 |
| 113 | Yoervis Medina | Mariners | 0.06 |
| 114 | Aaron Crow | Royals | 0.06 |
| 115 | Cesar Ramos | Rays | 0.03 |
| 116 | Adam Ottavino | Rockies | 0.03 |
| 117 | Andrew Bailey | Red Sox | 0.02 |
| 118 | Jim Johnson | Orioles | 0 |
| 119 | Matt Lindstrom | White Sox | 0 |
| 120 | Ryan Pressly | Twins | -0.02 |
| 121 | Ryan Webb | Marlins | -0.03 |
| 122 | Jared Burton | Twins | -0.03 |
| 123 | J.J. Hoover | Reds | -0.03 |
| 124 | Drew Storen | Nationals | -0.03 |
| 125 | Jerry Blevins | Athletics | -0.04 |
| 126 | Tom Wilhelmsen | Mariners | -0.05 |
| 127 | Kevin Jepsen | Angels | -0.05 |
| 128 | Craig Stammen | Nationals | -0.06 |
| 129 | Burke Badenhop | Brewers | -0.07 |
| 130 | Brian Duensing | Twins | -0.07 |
| 131 | Joe Ortiz | Rangers | -0.08 |
| 132 | Wilton Lopez | Rockies | -0.08 |
| 133 | Ross Wolf | Rangers | -0.08 |
| 134 | A.J. Ramos | Marlins | -0.09 |
| 135 | Danny Farquhar | Mariners | -0.09 |
| 136 | David Hernandez | Diamondbacks | -0.1 |
| 137 | Darin Downs | Tigers | -0.11 |
| 138 | Jose Cisnero | Astros | -0.12 |
| 139 | Bryan Shaw | Indians | -0.12 |
| 140 | Tony Sipp | Diamondbacks | -0.14 |
| 141 | Tim Stauffer | Padres | -0.15 |
| 142 | Brad Lincoln | Blue Jays | -0.16 |
| 143 | Wesley Wright | Astros | -0.16 |
| 144 | Cory Gearrin | Braves | -0.16 |
| 145 | Paul Clemens | Astros | -0.18 |
| 146 | Nick Hagadone | Indians | -0.19 |
| 147 | Vinnie Pestano | Indians | -0.19 |
| 148 | Jake McGee | Rays | -0.2 |
| 149 | Mike Dunn | Marlins | -0.2 |
| 150 | Michael Gonzalez | Brewers | -0.2 |
| 151 | Blake Beavan | Mariners | -0.21 |
| 152 | Phil Coke | Tigers | -0.21 |
| 153 | Joba Chamberlain | Yankees | -0.22 |
| 154 | Matt Guerrier | – – – | -0.22 |
| 155 | Heath Bell | Diamondbacks | -0.23 |
| 156 | Jonathan Broxton | Reds | -0.24 |
| 157 | Matt Albers | Indians | -0.24 |
| 158 | Garrett Richards | Angels | -0.24 |
| 159 | Alex Wilson | Red Sox | -0.26 |
| 160 | Rich Hill | Indians | -0.28 |
| 161 | George Kontos | Giants | -0.29 |
| 162 | Scott Rice | Mets | -0.29 |
| 163 | Josh Roenicke | Twins | -0.29 |
| 164 | Chris Perez | Indians | -0.29 |
| 165 | Logan Ondrusek | Reds | -0.3 |
| 166 | Travis Blackley | Astros | -0.35 |
| 167 | Kyle Farnsworth | Rays | -0.36 |
| 168 | Hector Ambriz | Astros | -0.37 |
| 169 | Mike Adams | Phillies | -0.39 |
| 170 | Clayton Mortensen | Red Sox | -0.4 |
| 171 | T.J. McFarland | Orioles | -0.4 |
| 172 | Ronald Belisario | Dodgers | -0.44 |
| 173 | Henry Rodriguez | – – – | -0.45 |
| 174 | Brandon Lyon | Mets | -0.46 |
| 175 | Esmil Rogers | Blue Jays | -0.51 |
| 176 | Bruce Chen | Royals | -0.53 |
| 177 | Adam Warren | Yankees | -0.57 |
| 178 | Jeremy Horst | Phillies | -0.58 |
| 179 | Jeremy Affeldt | Giants | -0.59 |
| 180 | Kelvin Herrera | Royals | -0.68 |
| 181 | Huston Street | Padres | -0.71 |
| 182 | Michael Kirkman | Rangers | -0.71 |
| 183 | Carlos Marmol | Cubs | -0.71 |
| 184 | Anthony Bass | Padres | -0.94 |
| 185 | Pedro Strop | – – – | -0.98 |
| 186 | Shawn Camp | Cubs | -1.01 |
| 187 | Hector Rondon | Cubs | -1.05 |
| 188 | Brandon League | Dodgers | -1.62 |
Revisiting The Nine Best First Basemen for 2013
In the weeks leading up to the 2013 season, I unveiled my predictions for The Nine best players at each position. Some of the lists look good, some look terrible at this point, but that’s all part of the fun. Over the next two weeks leading up to the All-Star Game I will be revisiting these lists to see how things are going so far, around the halfway mark.
Obviously, the early evaluations will feature fewer than half a season and the later lists will feature a bit more, but try to think of these as the state of the position at the halfway mark. I’ll be using Wins Above Replacement (WAR) to generate the rankings because it is the number that best captures the entire value of a player. It isn’t perfect, so don’t take the precise values too seriously, but it’s certainly the best way to make any type of holistic list. WAR values offense, defense, baserunning, and playing time, so it represents exactly what I was trying to capture when I made the rankings during Spring Training.
Here’s how this will work. Below, you’ll see all nine players I ranked in the preseason and any player who currently ranks in the top 9 at that position. The current ranking drives the order and the preseason ranking and their current WAR is noted. Hit, miss, and push distinctions are based on where their first half places them going forward. For example, I can miss on a player even if I expect them to play much better in the second half if their first half was so poor that it is impossible to make up the ground overall.
We’ve already covered the catchers, so let’s move on to first base. Here’s The Nine Best First Basemen for 2013. Numbers reflect start of play on July 6.
56. Mark Teixeira, Yankees (Preseason Rank: 6, 2013 WAR: -0.2)
Teixeira was more hurt than I knew when I wrote the original list. Nothing you can do about a guy who only plays 15 games during a season due to injury. MISS
49. Albert Pujols, Angels (Preseason Rank: 2, 2013 WAR: -0.1)
Albert Pujols stated slow last season and came on strong in the second half. I’m not sure if that’s going to happen again or if his foot and ankle injury will improve enough that he can contribute the way he should. Granted, I knew Pujols was on the wrong side of 30 when I wrote the list, so maybe I should have been more cautious about his decline, but it’s safe to say one shouldn’t assume an all-time great player will simply cease being valuable out of nowhere. He’s producing at league average with a 99 wRC+ from a position that demands offense and is below average on defense and on the bases. Pujols likely won’t be this bad all season, but there is no way he can recover enough to save the prediction. MISS
31. Adam LaRoche, Nationals (Preseason Rank: 4, 2013 WAR: 0.5)
He’s lost some power from his career year in 2012, but the OBP is nearly identical. LaRoche was my bold, wild card type pick, so I’m fine with being off the mark a bit. He’s defense rates below average this year despite being good each of the last three seasons. I assume that will turn around because 1B defensive skills shouldn’t deteriorate that quickly, so he’s probably more of a 2.5 WAR player than a 3.5 WAR player and that’s not a huge whiff. He’s probably a 10-13 1B for the whole season, so this is a miss, but not a huge one. MISS
30. Prince Fielder, Tigers (Preseason Rank: 3, 2013 WAR: 0.5)
Fielder, currently at 123 wRC+, is performing well on offensive relative to league average, but not compared to the bar he set for himself. At this pace, he’s like to finish near the 8-10 mark, but he could easily snap out of it and start hitting for more power at any moment. There’s nothing physically wrong with him and he’s had the occasional season in his career that was just pretty good instead of great at the plate, so he could easily slug .550 the rest of the way and no one would find it strange. He’s costly on defense, but that’s a constant. He’s a top 9 1B on offense right now, but not comfortably enough to make up for his defense. MISS
15. Anthony Rizzo, Cubs (Preseason Rank: 8, 2013 WAR: 1.3)
Despite some recent slumping Rizzo is only a bit off the pace he set in 2012 on which I based my evaluation. He’s 0.3 WAR back of 8th place, so I’m feeling pretty good right now. He’s playing strong defense and has a 110 wRC+. With a little better second half, he’s dead on. HIT
12. Freddie Freeman, Braves (Preseason Rank: 5, 2013 WAR: 1.4)
Freeman spent 15 days on the DL early in the season, but while he’s been on the field during the 70+ other games, he’s been right on pace for 5th. He’s the 6th best 1B by wRC+ and is hovering just below average on defense. Assuming he’s healthy and plays 140 games or so this season, he’s perfectly on track for the middle of the top 9. HIT
10. Allen Craig, Cardinals (Preseason Rank: 7, 2013 WAR: 1.5 WAR)
Craig is having essentially the exact season I’d have expected from him. In the initial ranking I said he was a phenomenal hitter (he’s 5th in wRC+) and nothing special with the glove (-2.2 UZR). His only issue would be health, which hasn’t bitten him yet and is just 0.1 WAR away from 7th on the list. If he doesn’t miss much time, this one looks great. HIT
9. Eric Hosmer, Royals (Preseason Rank: 9, 2013 WAR: 1.5)
Ha! Nailed it. He started a bit slow but things are picking up nicely and he has added value with the glove too. I’m a fan of his skills and think he can be a great player despite 2012’s disappointment. I’m not going to say much more and just bask in this precisely accurate ranking while it lasts. HIT
8. Brandon Belt, Giants (Preseason Rank: N/A, 2013 WAR:1.6)
I like Belt, but the Giants have been screwing with his swing and playing time so much over the years it’s hard to feel good about any sort of prediction. He’s a patient hitter with a solid glove and I like him a lot as a player, I just didn’t think it was a good idea to rank him in the top 9 because I couldn’t predict the playing time. MISS
7. Adrian Gonzalez, Dodgers (Preseason Rank: N/A, 2013 WAR: 1.6)
Someone asked about him when I posted the original piece and I said he’d have been 10 or 11 for me, so finding him at 7, just ahead of that spot isn’t surprising. He’s hitting for a little more power than I thought, but other than that is right on track for the season I thought he’d have. HIT
6. Mark Trumbo, Angels (Preseason Rank: N/A, 2013 WAR: 1.9)
Trumbo wasn’t ranked in the preseason because I expected him to get most of his reps at DH. Nothing you can really do about that one, but he’s a lowish OBP, high power guy who tends to run hot and cold. He’s actually be solid with the glove in Pujols’ stead, so I’m comfortable expecting him to finish near the back half of the list. PUSH
5. James Loney, Rays (Preseason Rank: N/A, 2013 WAR: 2.3)
I saw this coming. Not this exactly, but I did. Go to #30 on this list of bold predictions and you’ll see. I didn’t think he’d be a top 9 guy, but I’m taking credit for this because so few people had good things to say abut Loney going into the year. He’s always been a guy who could play defense and hit for average, but he was caught in between while looking to add power in LA, so arriving in Tampa and being told not to worry about it seems to have helped. HIT.
4. Edwin Encarnacion, Jays (Preseason Rank: N/A, 2013 WAR: 2.5)
I had Encarnacion figured in for a lot of games at DH, which has sort of happened. 45 games at 1B, 29 at DH, 10 at 3B so I didn’t expect him to add as much value because of the DH positional adjustment in WAR. I expected him to mash, but not to add this kind of overall value. I’m calling it a push because it was more of a playing time mistake than a production one. PUSH
3. Joey Votto, Reds (Preseason Rank: 1, 2013 WAR: 3.4)
Joey Votto is great and I said he would be great. His defensive rating is below average, which I don’t think will continue and that is the only think keeping him from another MVP type season. Votto is right on track for the 6.5-7.5 WAR season that I figured for him. HIT
2. Paul Goldschmidt, Dbacks (Preseason Rank: N/A, 2013 WAR: 3.4)
Goldy was someone I agonized over and left him off with A-Gon right on the cusp. He’s been good enough to make that prediction a miss, but I do want to make clear I liked him a lot coming in, just not quite as much as I should have. He has amazingly gotten better from year to year across the board since coming to the big leagues and is very much in the MVP conversation with Votto and several other guys who will appear on other lists. I’m a Goldy fan and regret not putting him on the preseason list. MISS
1. Chris Davis, Orioles (Preseason Rank: N/A, 2013 WAR: 4.6)
Yeah, didn’t see this coming. No one did. Not even Chris Davis’ mother expected him to elevated his game to near-Cabreraian levels. He’s mashing and is right in the thick of the AL MVP race. He’s not this good, but he’s also clearly good enough to hang on this list the rest of the way and I wouldn’t have put him in the top 12. Easily a miss and pretty darn impressive. I’m not buying him to finish #1, but he’s earned it for now. MISS
Check back for more The Nine updates featuring the other positions. How will these lists look come October? Sounds off in the comments section.
The Morning Edition (July 7, 2013)
From Last Night:
- MLB All-Star Game participants announced, see below for commentary
- Sale goes 7, gives up 2 ER, 1 BB, and Ks 9…loses again….
- Cardinals walk off on the Fish
- Santana and Parker both solid, but the bullpens decide it in favor of the Royals
- Dickey goes deep into the game, but surrenders 6 runs as the Twins beat the Jays
What I’m Watching Today:
- Kuroda goes against the O’s (1p Eastern)
- Strasburg toes the slab in DC (1p Eastern)
- Danks and Price hook up in Tampa (130p Eastern)
- Fernandez takes on the Cardinals (2p Eastern)
- Burnett comes off the DL to face the Cubs (2p Eastern)
- Kershaw faces the Giants (4p Eastern)
The Big Question:
- How do the All-Star rosters look?
So let me break the ASG rosters down in a very simple way. I’m only going to point out players who got left off criminally and players who probably shouldn’t be on the team. As usual, most of the roster is right, and it’s messed up at the margins. Here are my AL and NL picks and here are the full rosters.
Players Who Should Be on the Rosters:
- Evan Longoria is 6th in MLB in position player WAR, the only AL reserve who could even reasonably be considered more deserving than Longoria is Machado. It’s a crime that Longo isn’t in the game.
- Josh Donaldson is 9th in WAR and is on the outside looking in because you can’t have a million 3B on your team. It’s understandable that one of these guys got left off, it’s unacceptable that both didn’t make it. Either could go as a DH, or replace one of the catching backups or one of the 3 backup 2B.
- Honorable mention to Kyle Seager, because he belongs, but 3B is too deep to make much of a case.
- Ellsbury and Gardner are also better choices than Hunter and Cruz, but it’s less egregious.
- Marte and Choo probably belong over Dom Brown
- Derek Holland is 4th in MLB in pitcher WAR but isn’t on the roster. Not much justification for that.
- Homer Bailey is 5th in the NL in pitcher WAR but isn’t on the roster, hard to buy Locke, Wood, and Bumgarner over him
Players Who Shouldn’t Be on the Roster
- I know he was voted by the fans, so it’s a popularity thing, but Adam Jones has very little business being in the game over some of the guys who missed.
- Bartolo Colon probably doesn’t need to be on the roster, but he has 11 wins, and those are shiny. His A’s teammate Josh Donaldson should get to go in his place even if they play different positions
- Prince Fielder really shouldn’t be an All-Star, but he’s in because he’s well known, has RBI, and it is a pretty down year for 1B in the AL. Longoria or Donaldson really should go in his place
- I love Ben Zobrist, but he has to only be in the game over Longoria because he’s versatile and can fill in for injured guys. There is nothing else that justifies him being on the team over Longo
- Cruz and Hunter together make one good All-Star, but each on their own doesn’t do much for me. Not a huge error, but probably not deserving given who was left off
- Brandon Phillips should not be an All-Star this year. Fan vote, so can’t say too much.
- Dominic Brown is probably a no for me, but it’s not terrible.
I’m sure some of you disagree with these comments, but that’s the way this works. Undeserving players get picked because of name value or voters looking at the wrong numbers, but I stand by the ones about which I wrote most strongly. Longoria and Donaldson must be All-Stars. I don’t care who comes off as long as it isn’t Cabrera, Gomez, Trout, Davis, or Wright. Literally, 2 of the top 10 players in baseball aren’t going to the game. Come on guys.
Picking the National League All-Stars
With the All-Star rosters looming ahead this weekend, New English D weighs into the fray with these picks. We covered the AL yesterday. A few notes up front. First, I’ve conformed the roster size to the official requirements and have selected starters I feel are most deserving based on their 2013 seasons and have given no deference to the voting up through this point. My view is that the All-Star Game should showcase the game’s standout performers from the first half of 2013, not the best players over the last year or the best players by talent even if they haven’t performed. I think the game should highlight the players who play well, not the players MLB thinks are “marketable.” Every team is represented and I’ve given a list of players who are the first replacements for injuries and such. As you know, this site appreciates advanced statistics, so should you choose to comment on these selections, please do so without using “RBI” or “Wins.” Finally, I watch a ton of baseball, but I watch fewer NL games by function of being a Tigers fan, so some of the down ballot selections are a bit less sure footed.
And I just couldn’t leave Puig out. He has to play in this game.
| PLAYER | TEAM | POSITION |
| Yadier Molina | Cardinals | C |
| Joey Votto | Reds | 1B |
| Matt Carpenter | Cardinals | 2B |
| Jean Segura | Brewers | SS |
| David Wright | Mets | 3B |
| Carlos Gomez | Brewers | OF |
| Andrew McCutchen | Pirates | OF |
| Carlos Gonzalez | Rockies | OF |
| Buster Posey | Giants | DH |
| Matt Harvey | Mets | SP |
| Russell Martin | Pirates | C |
| Paul Goldschmidt | Dbacks | 1B |
| Allen Craig | Cardinals | 1B |
| Chase Utley | Phillies | 2B |
| Ian Desmond | Nationals | SS |
| Pedro Alvarez | Pirates | 3B |
| Starling Marte | Pirates | OF |
| Bryce Harper | Nationals | OF |
| Shin Soo Choo | Reds | OF |
| Yasiel Puig | Dodgers | OF |
| Michael Cuddyer | Rockies | OF |
| Todd Frazier | Reds | 3B |
| Adam Wainwright | Cardinals | SP |
| Cliff Lee | Phillies | SP |
| Clayton Kershaw | Dodgers | SP |
| Homer Bailey | Reds | SP |
| Mat Latos | Reds | SP |
| Jeff Samardzija | Cubs | SP |
| Jordan Zimmermann | Nationals | SP |
| Jose Fernandez | Marlins | SP |
| Craig Kimbrel | Braves | RP |
| Sergio Romo | Giants | RP |
| Mark Melancon | Pirates | RP |
| Jason Grilli | Pirates | RP |
| Ryan Braun* | Brewers | OF |
| Troy Tulowitzki* | Rockies | SS |
| Evereth Cabrera* | Padres | SS |
| FIRST REPLACEMENTS | ||
| Jhoulys Chacin | Rockies | SP |
| Patrick Corbin | Dbacks | SP |
| Shelby Miller | Cardinals | SP |
| Stephen Strasburg | Nationals | SP |
| Chris Johnson | Braves | 3B |
| Carlos Beltran | Cardinals | OF |
| Dominic Brown | Phillies | OF |
| * INJURED |
The Nine Worst 20 Win Season in MLB History
To regular readers it will come as no surprise that I’m part of the movement to remove the pitcher won/loss record from our baseball evaluations. I’ve written on the subject quite a bit, both with respect to individual seasons and entire careers, and this piece seems like a perfect fit to round out the discussion. It also helps that I got a direct request for this exact thing after I posted yesterday’s piece:
So what follows are The Nine Worst 20 Win Seasons in MLB history. It gets a little tricky to draw lines here, so let me give you a quick primer. I don’t want this post to be about pitchers who made a lot of starts so they got a lot of wins, but rather about pitchers who performed poorly and still got wins. Therefore, instead of using Wins Above Replacement as I did for the under 9 list, I will be using ERA- and FIP-, which are simply statistics that calculate the difference between a pitcher’s ERA or FIP and league average during that year. Also it controls for park effects, but it’s basically a way to compare an ERA from the deadball era to one from the steroid era.
I would personally prefer to see this done with FIP-, because it better reflects a pitcher’s skill, but I’m going to use ERA- as well so that this piece is more convincing. A pitcher who allows a lot of runs shouldn’t win a lot of games, and you should agree with that if you’re old school or new school.
Additionally, I’ve included lists from 1901-2012 and just 1945-2012 if you’re concerned about the number of starts inflating someone’s win total. That’s fair, so I’ve broken it down into four separate lists, all telling you the same thing. You can have a bad year and win 20 games. 20 games is the old school gold standard of performance, so this cutoff makes sense. If you’ll recall, there have been more than 8,000 qualifying seasons in MLB history and if you try to predict WAR, ERA, or FIP with wins, you get an adjusted R squared of less than .40 in all cases. This isn’t just about a few examples, it’s about the entire population of starting pitchers. For more on this, read the two links above and check out the bottom of this piece.
Here we go.
1945-2012 by ERA-
| Rank | Season | Name | Team | W | L | IP | ERA- |
| 9 | 1950 | Johnny Sain | Braves | 20 | 13 | 278.1 | 100 |
| 8 | 1965 | Sammy Ellis | Reds | 22 | 10 | 263.2 | 101 |
| 7 | 1973 | Paul Splittorff | Royals | 20 | 11 | 262 | 102 |
| 6 | 1971 | Steve Carlton | Cardinals | 20 | 9 | 273.1 | 103 |
| 5 | 1970 | Jim Merritt | Reds | 20 | 12 | 234 | 104 |
| 4 | 1980 | Joe Niekro | Astros | 20 | 12 | 256 | 106 |
| 3 | 1972 | Stan Bahnsen | White Sox | 21 | 16 | 252.1 | 113 |
| 2 | 1959 | Lew Burdette | Braves | 21 | 15 | 289.2 | 113 |
| 1 | 1966 | Denny McLain | Tigers | 20 | 14 | 264.1 | 113 |
1945-2012 by FIP-
| Rank | Season | Name | Team | W | L | IP | FIP- |
| 9 | 1971 | Dave McNally | Orioles | 21 | 5 | 224.1 | 110 |
| 8 | 1967 | Mike McCormick | Giants | 22 | 10 | 262.1 | 110 |
| 7 | 1959 | Lew Burdette | Braves | 21 | 15 | 289.2 | 111 |
| 6 | 1990 | Bob Welch | Athletics | 27 | 6 | 238 | 112 |
| 5 | 1958 | Bob Turley | Yankees | 21 | 7 | 245.1 | 112 |
| 4 | 1979 | Joe Niekro | Astros | 21 | 11 | 263.2 | 114 |
| 3 | 1967 | Earl Wilson | Tigers | 22 | 11 | 264 | 114 |
| 2 | 1973 | Catfish Hunter | Athletics | 21 | 5 | 256.1 | 122 |
| 1 | 1966 | Denny McLain | Tigers | 20 | 14 | 264.1 | 123 |
1901-2012 by ERA-
| Rank | Season | Name | Team | W | L | IP | ERA- |
| 9 | 1910 | George Mullin | Tigers | 21 | 12 | 289 | 109 |
| 8 | 1914 | Christy Mathewson | Giants | 24 | 13 | 312 | 110 |
| 7 | 1911 | Jack Coombs | Athletics | 28 | 12 | 336.2 | 110 |
| 6 | 1906 | Christy Mathewson | Giants | 22 | 12 | 266.2 | 112 |
| 5 | 1972 | Stan Bahnsen | White Sox | 21 | 16 | 252.1 | 113 |
| 4 | 1919 | Hooks Dauss | Tigers | 21 | 9 | 256.1 | 113 |
| 3 | 1959 | Lew Burdette | Braves | 21 | 15 | 289.2 | 113 |
| 2 | 1966 | Denny McLain | Tigers | 20 | 14 | 264.1 | 113 |
| 1 | 1903 | Henry Schmidt | Superbas | 22 | 13 | 301 | 118 |
1901-2012 by FIP-
| Rank | Season | Name | Team | W | L | IP | FIP- |
| 9 | 1911 | Bob Harmon | Cardinals | 23 | 16 | 348 | 114 |
| 8 | 1921 | Joe Oeschger | Braves | 20 | 14 | 299 | 114 |
| 7 | 1967 | Earl Wilson | Tigers | 22 | 11 | 264 | 114 |
| 6 | 1903 | Henry Schmidt | Superbas | 22 | 13 | 301 | 114 |
| 5 | 1906 | Jack Taylor | – – – | 20 | 12 | 302.1 | 115 |
| 4 | 1910 | George Mullin | Tigers | 21 | 12 | 289 | 117 |
| 3 | 1908 | Nick Maddox | Pirates | 23 | 8 | 260.2 | 121 |
| 2 | 1973 | Catfish Hunter | Athletics | 21 | 5 | 256.1 | 122 |
| 1 | 1966 | Denny McLain | Tigers | 20 | 14 | 264.1 | 123 |
And now, to bring the point home even further, let’s put an innings cap at 210 and take a look at 15+ win seasons since 1945 by ERA-
| Rank | Season | Name | Team | W | L | GS | IP | ERA | FIP | WAR | FIP- | ERA- |
| 9 | 2003 | Ramon Ortiz | Angels | 16 | 13 | 32 | 180 | 5.2 | 5.26 | 0.9 | 119 | 117 |
| 8 | 1983 | Eric Show | Padres | 15 | 12 | 33 | 200.2 | 4.17 | 4.37 | 0.3 | 121 | 118 |
| 7 | 1989 | Storm Davis | Athletics | 19 | 7 | 31 | 169.1 | 4.36 | 4.4 | 0.5 | 123 | 119 |
| 6 | 2004 | Shawn Estes | Rockies | 15 | 8 | 34 | 202 | 5.84 | 5.54 | 1 | 112 | 120 |
| 5 | 1966 | Dave Giusti | Astros | 15 | 14 | 33 | 210 | 4.2 | 3.57 | 2.6 | 105 | 120 |
| 4 | 1999 | Kirk Rueter | Giants | 15 | 10 | 33 | 184.2 | 5.41 | 5.01 | 1.1 | 113 | 124 |
| 3 | 1989 | Andy Hawkins | Yankees | 15 | 15 | 34 | 208.1 | 4.8 | 4.44 | 1.2 | 117 | 124 |
| 2 | 1969 | Steve Blass | Pirates | 16 | 10 | 32 | 210 | 4.46 | 3.72 | 2 | 109 | 126 |
| 1 | 1980 | Dan Spillner | Indians | 16 | 11 | 30 | 194.1 | 5.28 | 4.45 | 1.4 | 110 | 130 |
And now again with FIP-
| Rank | Season | Name | Team | W | L | G | GS | IP | ERA | FIP | WAR | ERA- | FIP- |
| 9 | 2012 | Barry Zito | Giants | 15 | 8 | 32 | 32 | 184.1 | 4.15 | 4.49 | 0.9 | 110 | 120 |
| 8 | 1983 | Eric Show | Padres | 15 | 12 | 35 | 33 | 200.2 | 4.17 | 4.37 | 0.3 | 118 | 121 |
| 7 | 1984 | Eric Show | Padres | 15 | 9 | 32 | 32 | 206.2 | 3.4 | 4.23 | 0.7 | 97 | 122 |
| 6 | 1963 | Phil Regan | Tigers | 15 | 9 | 38 | 27 | 189 | 3.86 | 4.58 | 0 | 104 | 123 |
| 5 | 1989 | Storm Davis | Athletics | 19 | 7 | 31 | 31 | 169.1 | 4.36 | 4.4 | 0.5 | 119 | 123 |
| 4 | 1975 | Jack Billingham | Reds | 15 | 10 | 33 | 32 | 208 | 4.11 | 4.43 | 0.4 | 114 | 124 |
| 3 | 2006 | Steve Trachsel | Mets | 15 | 8 | 30 | 30 | 164.2 | 4.97 | 5.5 | 0.1 | 114 | 125 |
| 2 | 1971 | Chuck Dobson | Athletics | 15 | 5 | 30 | 30 | 189 | 3.81 | 4.19 | 0.1 | 117 | 126 |
| 1 | 1950 | Tommy Byrne | Yankees | 15 | 9 | 31 | 31 | 203.1 | 4.74 | 5.51 | 0.5 | 107 | 128 |
Even when we limit the number of innings a pitcher throws, pitchers can still accumulate wins despite pitching much worse than league average.
So whether you like the simple and easy ERA or the more predictive and true FIP, here you have plenty of evidence that winning a lot of games doesn’t mean you had a good season. Guys on this list were 10 and 20% worse than league average in these seasons and still won the magic 20 games. This is further proof that wins do not reflect a pitcher’s individual performance.
You can be worse than average and still win at an elite level. Last week I showed how you can be much better than average and win fewer than 10 games. Yesterday, I showed that this isn’t a small sample size, single season trick. This is true in small samples and in large samples.
Here’s a quick look at every individual season in MLB history again up against ERA-. There is a trend, but the variation is huge. The adjusted R squared is .3046, meaning wins can only explain 30% of the variation in ERA relative to league average.

FIP- actually makes wins fare worse, at .1709 adjusted R squared. I won’t bother showing the graph because this one makes the point just fine. You can have an all time great season at run prevention and win 10 games and you can have a well below average season and win 20. Wins are about many factors and pitching is just one of them. You can have a great outing, great season, and great career and never get the wins you deserve and the exact opposite is true as well.
It’s time to outgrow the win and start talking about things that actually measure performance. Even if it’s ERA, which isn’t even the best way to do things. Let’s look at innings and strikeouts and FIP and WAR and everything else. Wins are the oldest statistic there is but they’ve long since lost their usefulness.
If you’re someone who believes heavily in wins, I challenge you to write a cogent response that defends their use. I’d be happy to publish it if you don’t have your own forum and will respond to your arguments. I want to be someone who helps move sabermetrics from a niche tool to the mainstream and I don’t want this to be about drawing lines between people who love baseball. This is my argument against wins, I hope that you take it to heart and really think about it.
Ask questions, look for evidence, and let’s talk about baseball. Share this with people who love wins and hate them. This shouldn’t be a partisan debate between the new and old, it should be about knowledge and fun. Always.
